Channel Analytics Dashboard
The Channel Analytics dashboard presents useful graphs for collected metrics, enabling rapid identification of changing health and performance information over time.
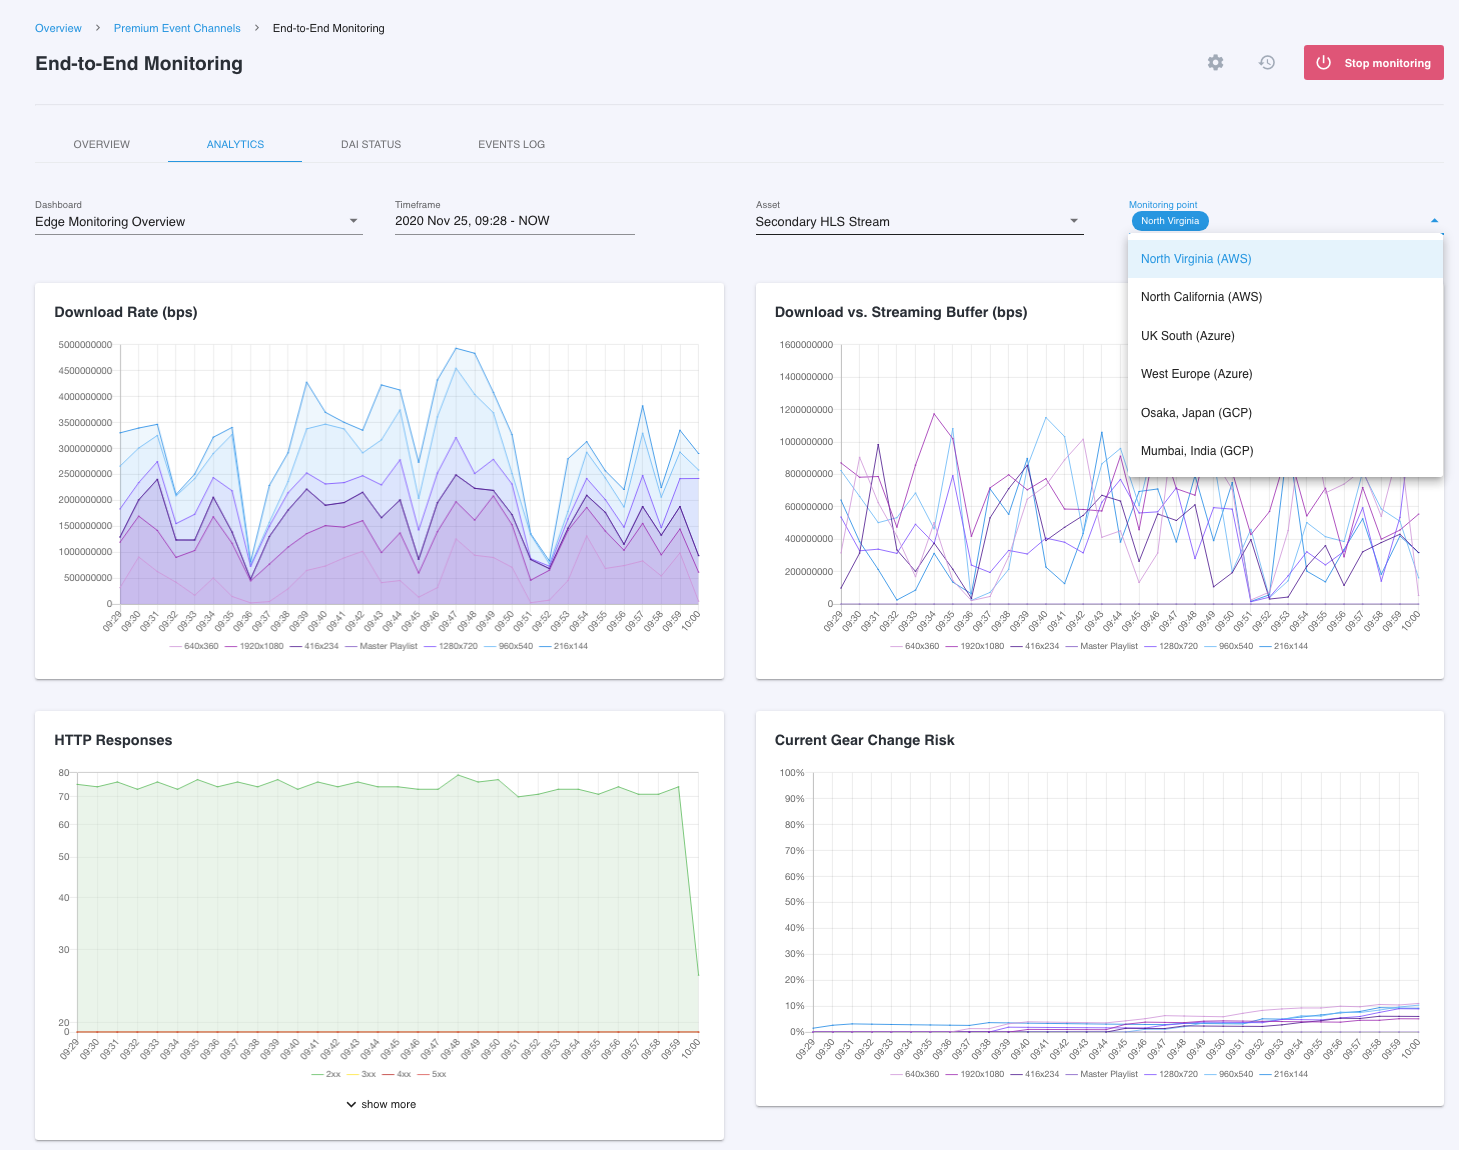
The Channel Analytics dashboard presents collected metric data graphed over specified time ranges. This can be very useful for identifying what conditions have changed and when the changes started happening.
Contribution vs Edge Dashboard Option
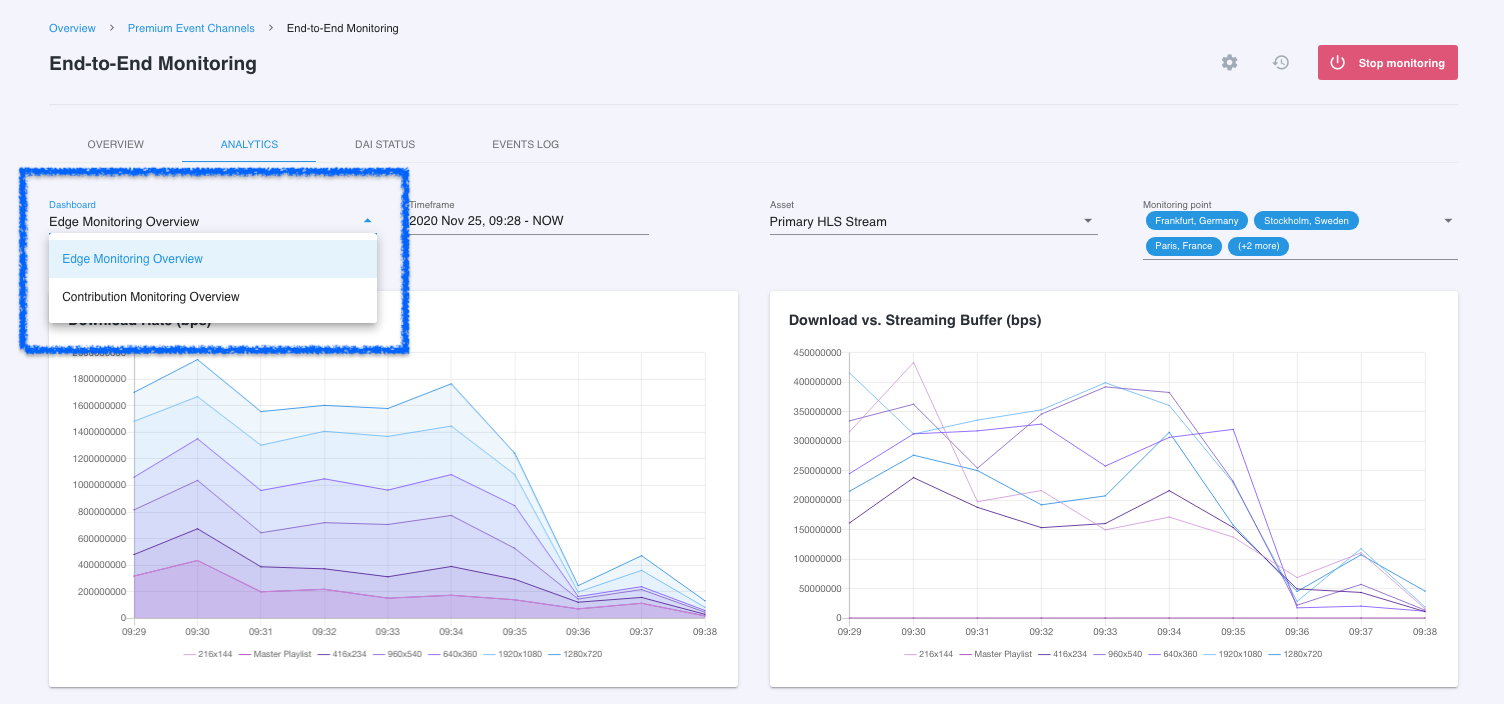
If your channel includes both contribution and edge assets, you will be presented with the option to switch the analytics dashboard to the class of monitoring your interested in. This is done under the dashboard drop down option. You can see an example of this here.
Specify Metric Date/Time Range
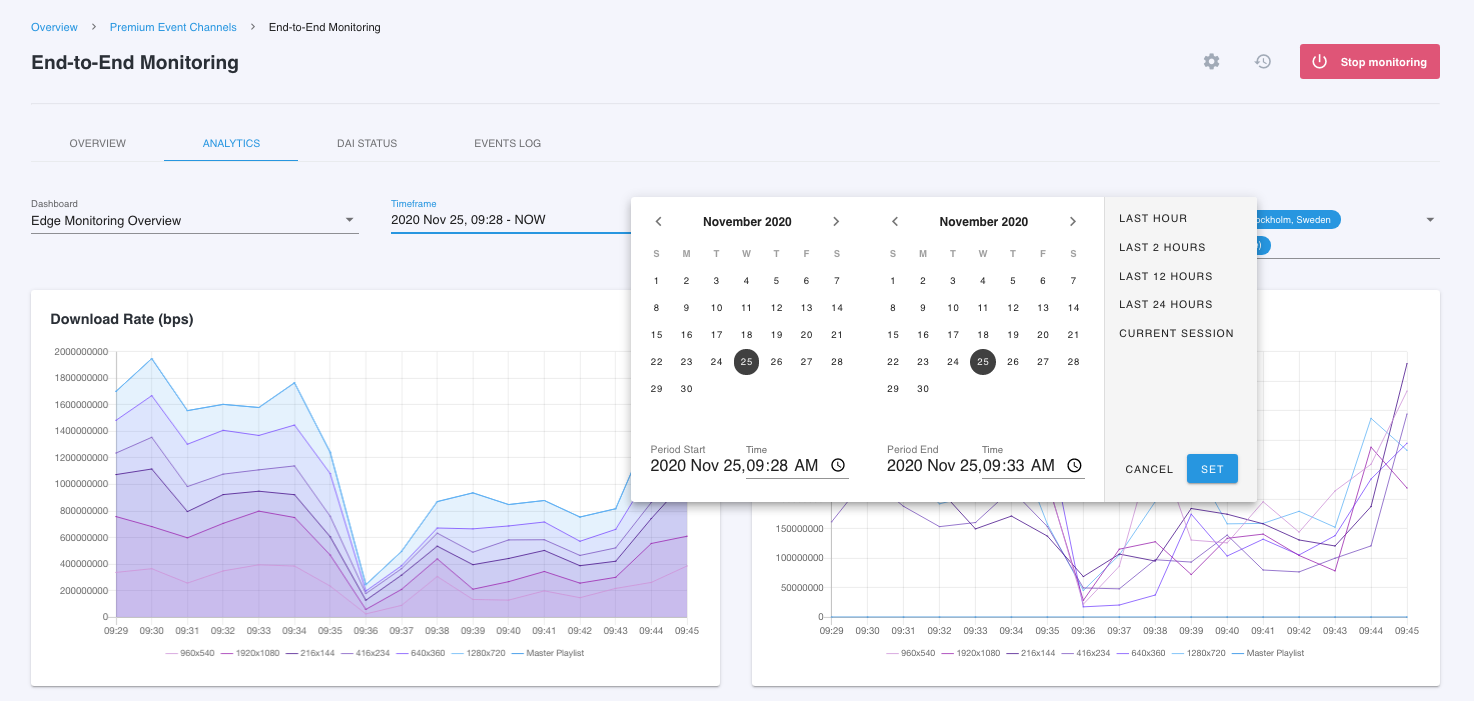
It is easy to dial in specific periods of time that are of interest. It is generally best to try to limit the amount of time presented in the graphs to avoid filling the graphs with too much data. You can specify any date and time range within the data retention period you set when creating the project that the current channel is in. Projects can be configured with 7 days (default), 30 days and 60 days data retention periods. For more information on setting the data retention policy for a project, please visit the Configure a Monitor Project section. The graphs automatically update each minute.
Select Asset
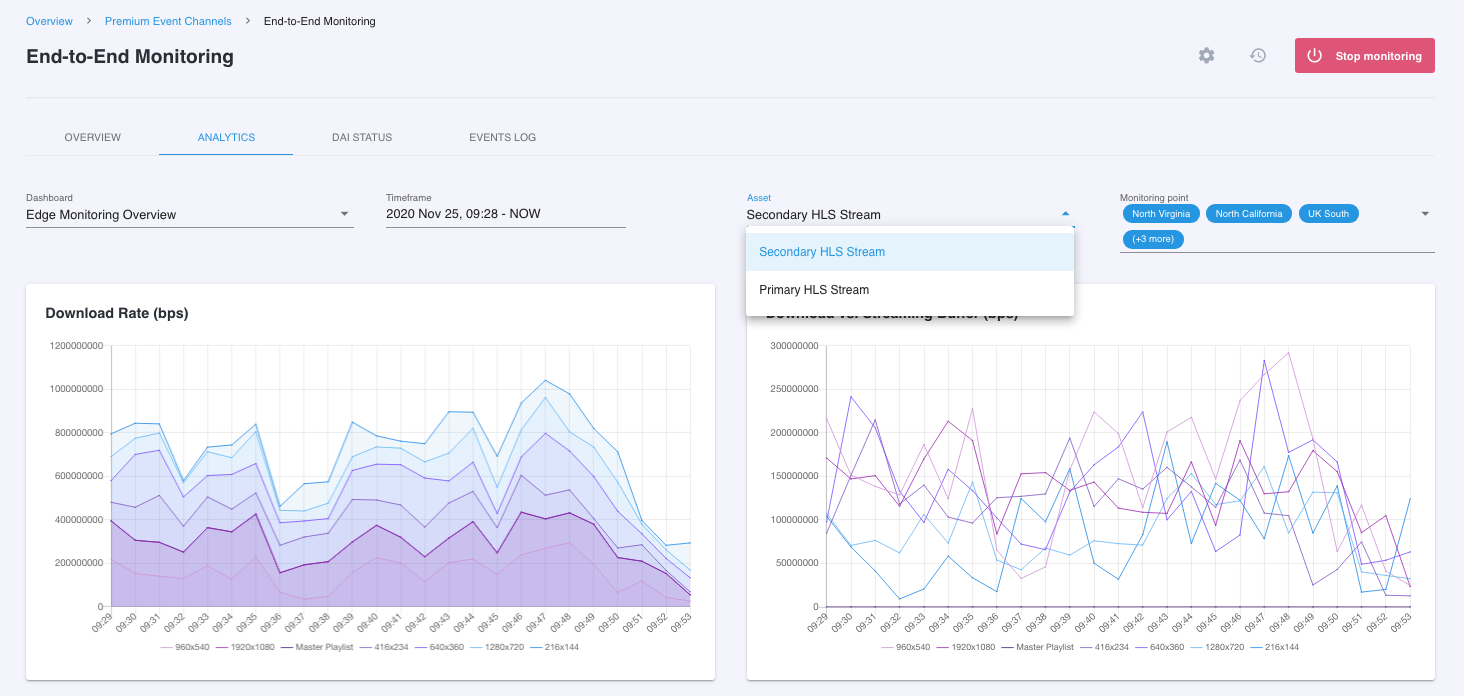
If there are multiple assets associated with the selected monitoring type, you will need to specify which asset to display in the metric graphs. In the below example, there are two edge assets associated with the channel. Once the asset is selected, the graphs will update with the metric data specific to that asset.
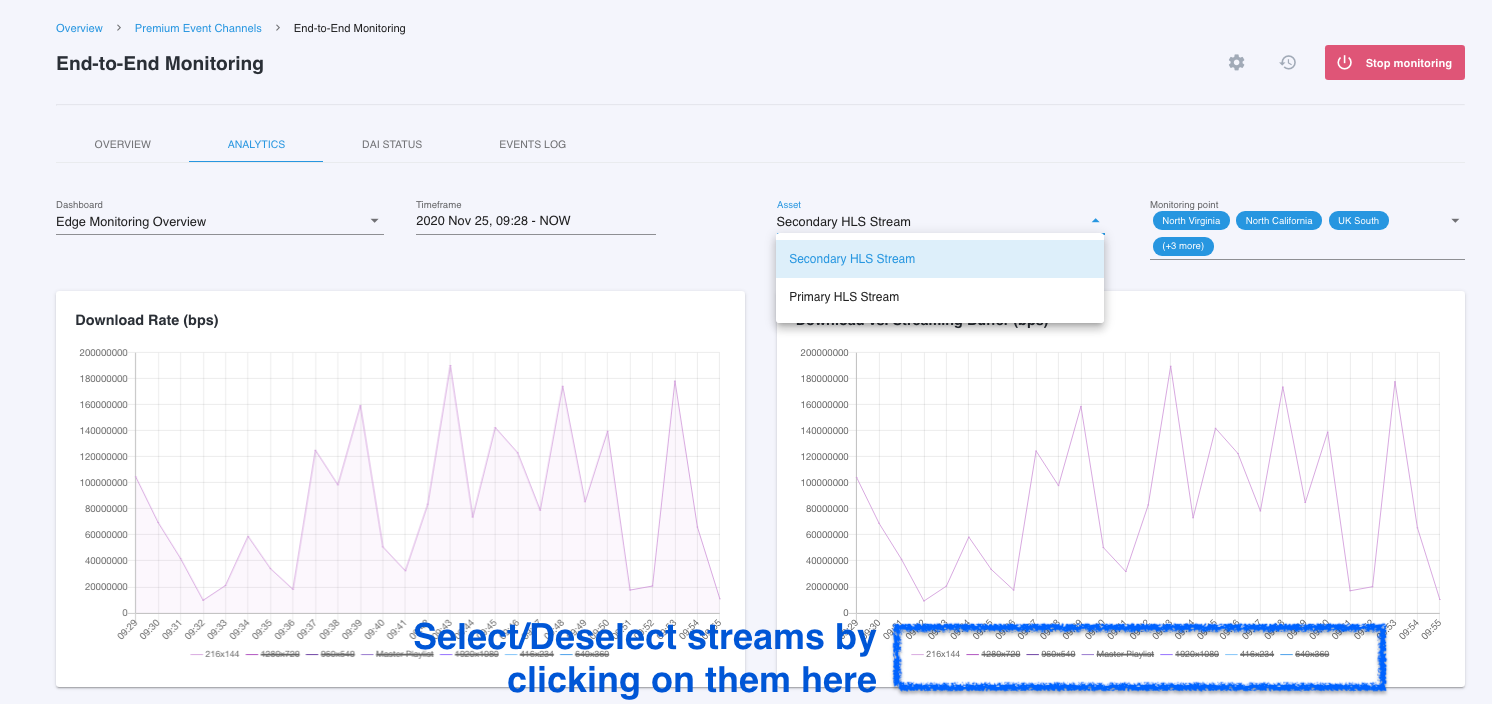
Note: Edge ABR assets will typically include many streams and will typically be monitored in several monitoring points. When you select the asset, the metric data for all streams measured in all monitoring points will automatically load. You can select/deselect each stream and monitoring point if you are interested in seeing data for a specific stream or monitoring point.
Specifying Monitoring Point
The graph data represented will be specific to the monitoring point or points selected. Simply select the active monitoring point or points that you'd like to display graphed metric data for.
Updated over 5 years ago
