Channel Overview Dashboard
The Channel Overview dashboard presents a live summary of the health of the channel.
Channel Overview Dashboard
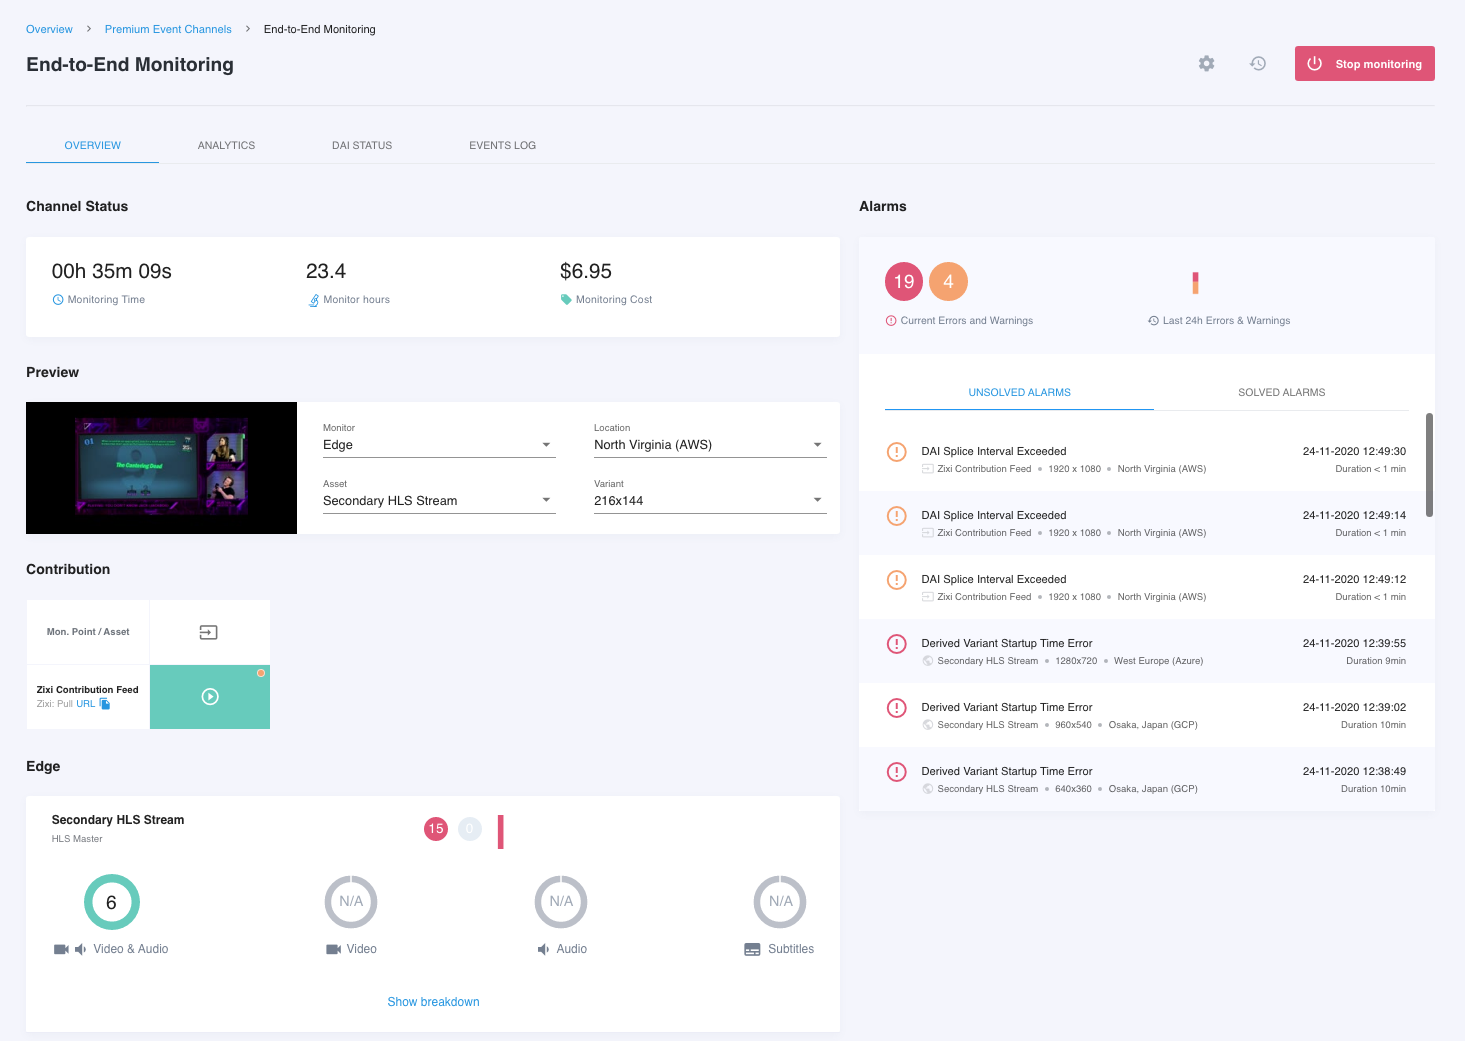
The channel overview dashboard is a collection of useful displays that help provide a high level summary of the current health and status of all assets associated with the current channel. The dashboard consists of the following sections:
- Channel Status
- Preview
- Contribution
- Edge
- Alarms
- Asset Status Details Drawer
Channel Status
The Channel Status section provides a quick glance at how long the channel has been running and an estimation on number of service unit hours and charges that the monitoring channel has consumed since it was started. This can provide easily understood metrics to help evaluate the overall cost of monitoring for a given channel as well as a confirmation on the length of time that has passed since channel monitoring began.
*Note: Monitoring Time and Monitor Hours are not the same measure. Monitoring time represents the total time since the current monitoring session was started. Monitor hours is calculated based on the number of monitoring points active, the types of monitoring being used (contribution vs edge), special features that may impact the consumption rate (UHD, HEVC, Dolby Digital decoding, etc...) and the amount of time that monitoring has been active.

Preview
The preview pane is intended to provide a visual confirmation that what is being monitored matches the channel content expected. This is done by displaying a representative thumbnail from a selected stream. You can choose from either a contribution or edge ABR asset. For edge assets being monitored in multiple regions, you can select the specific stream variant and region that you'd like to get a quick look at.

Contribution Feed Asset Monitor Status
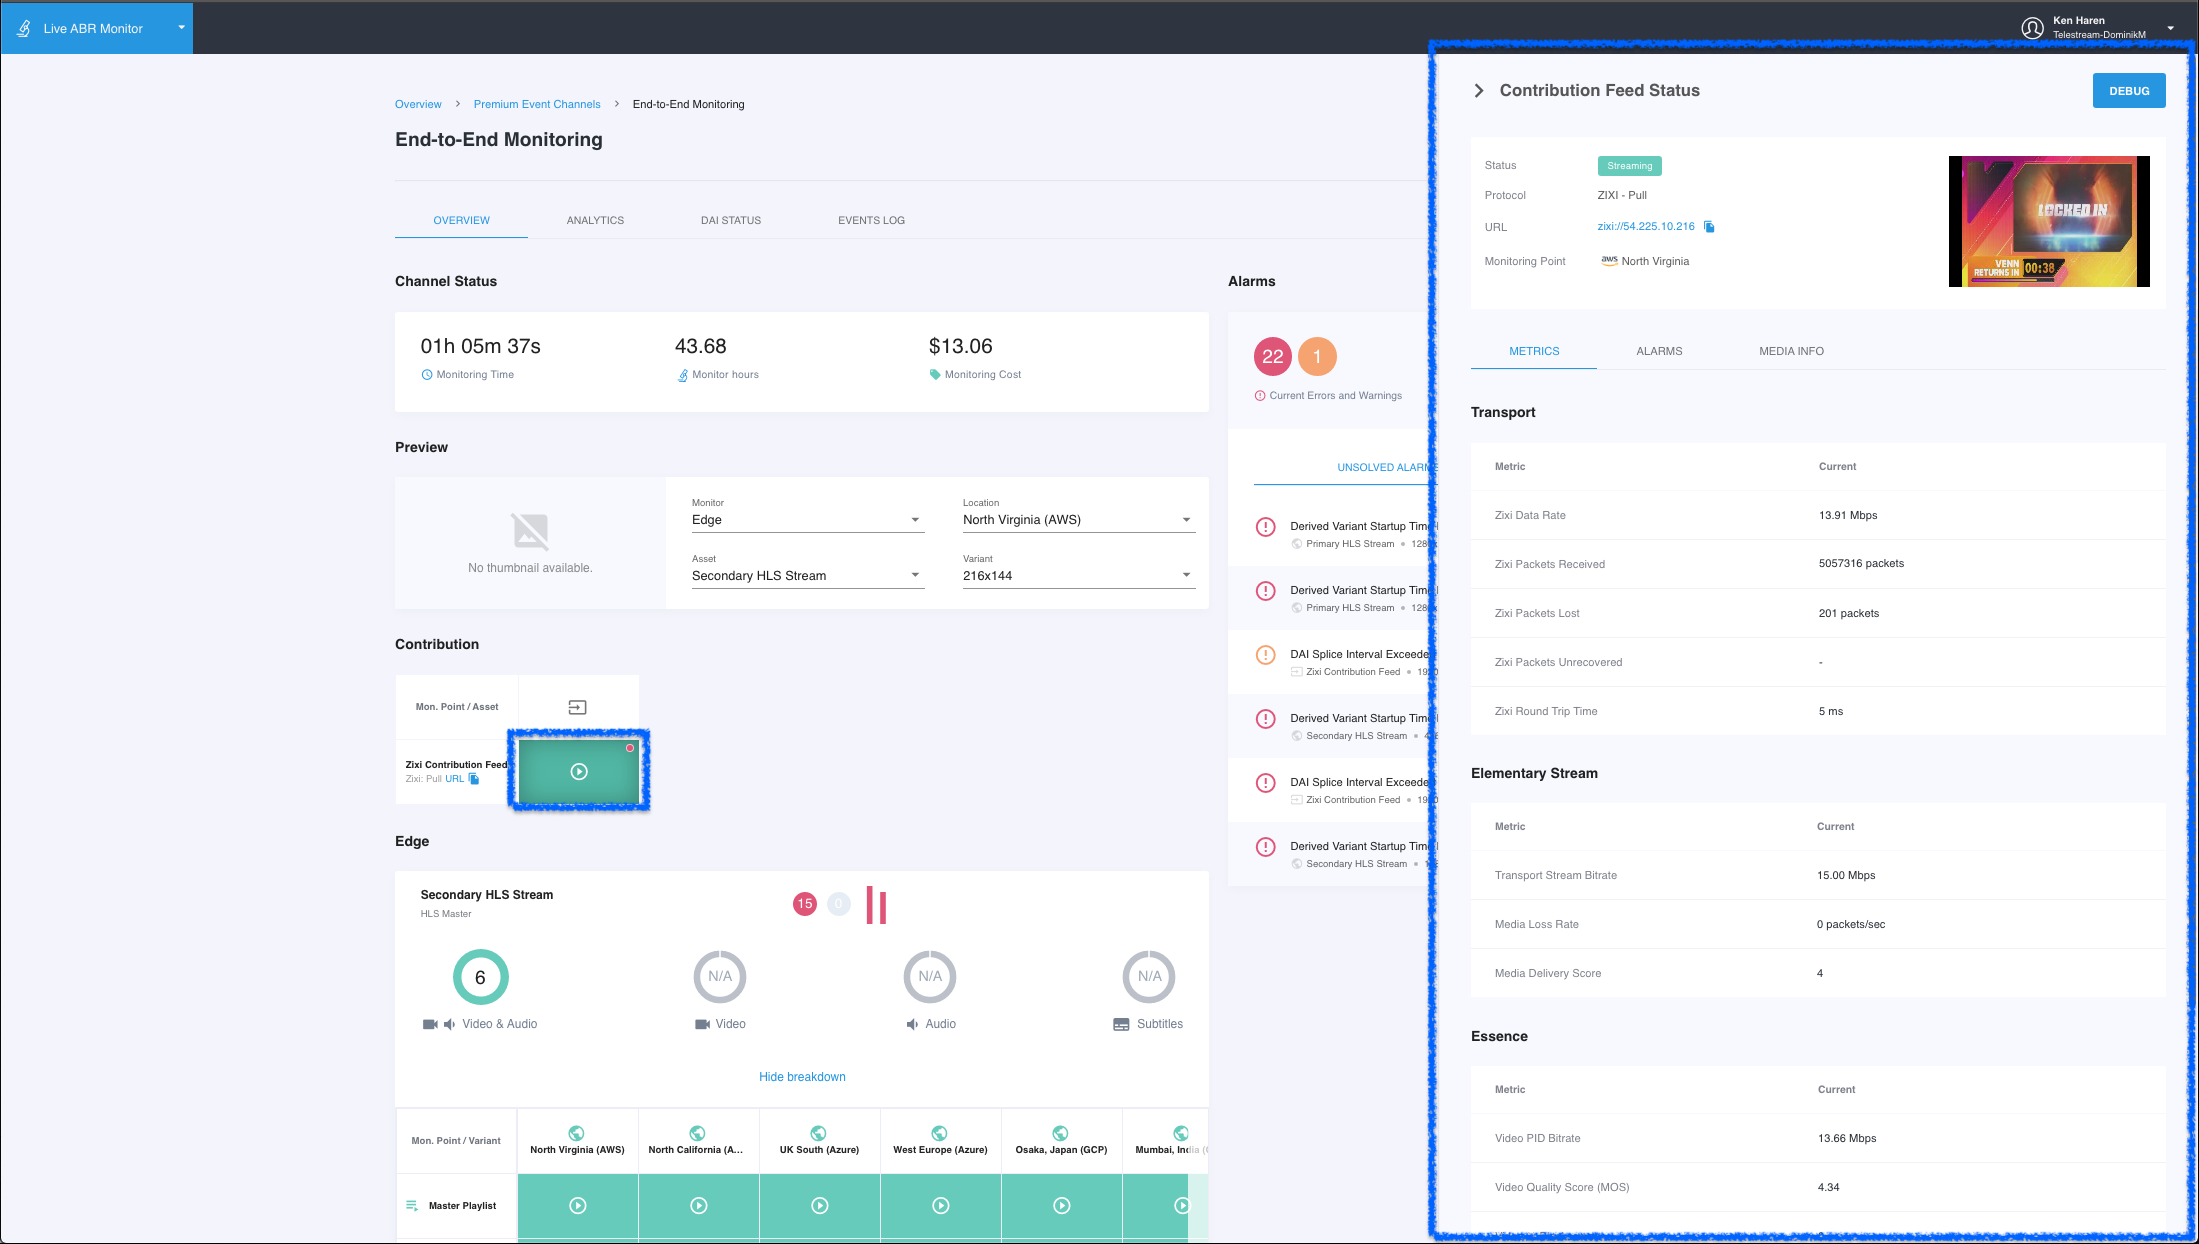
If the channel includes one or more contribution assets, their status will be represented in the contribution section. If the stream is completely healthy with no active warning or alarms, a green box will display. A red or yellow dot inside the green box indicates that the contribution feed is active and the monitoring point is seeing a valid transport stream, but that something is either in an alarm (red) or warning (yellow) state. You can see an example of the alarm indicator in the image below. If the entire box is red, this is usually indicative of an outage, where the monitoring point cannot establish a connection to the asset.

Edge Feed Asset Monitor Status
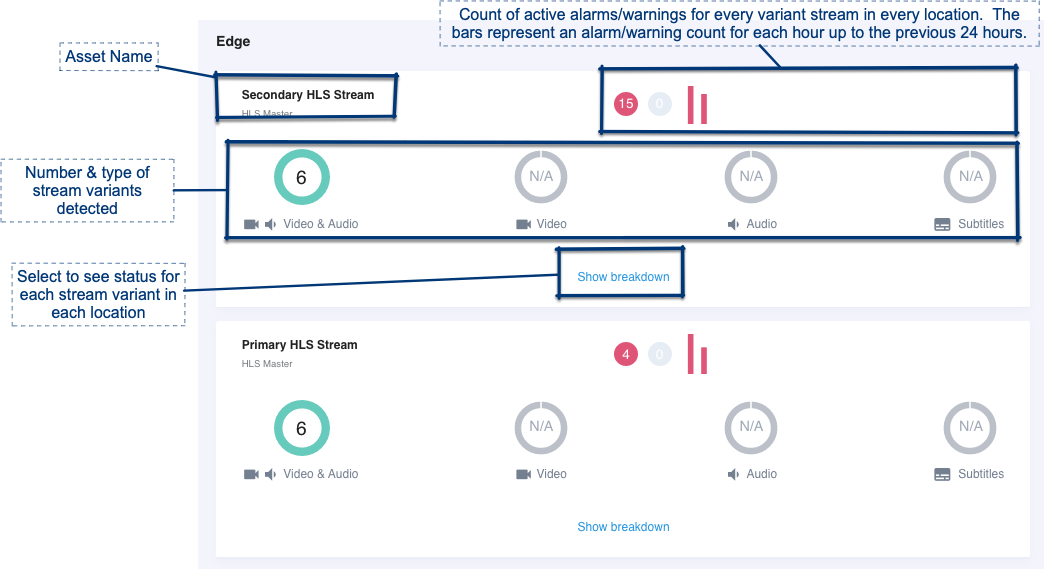
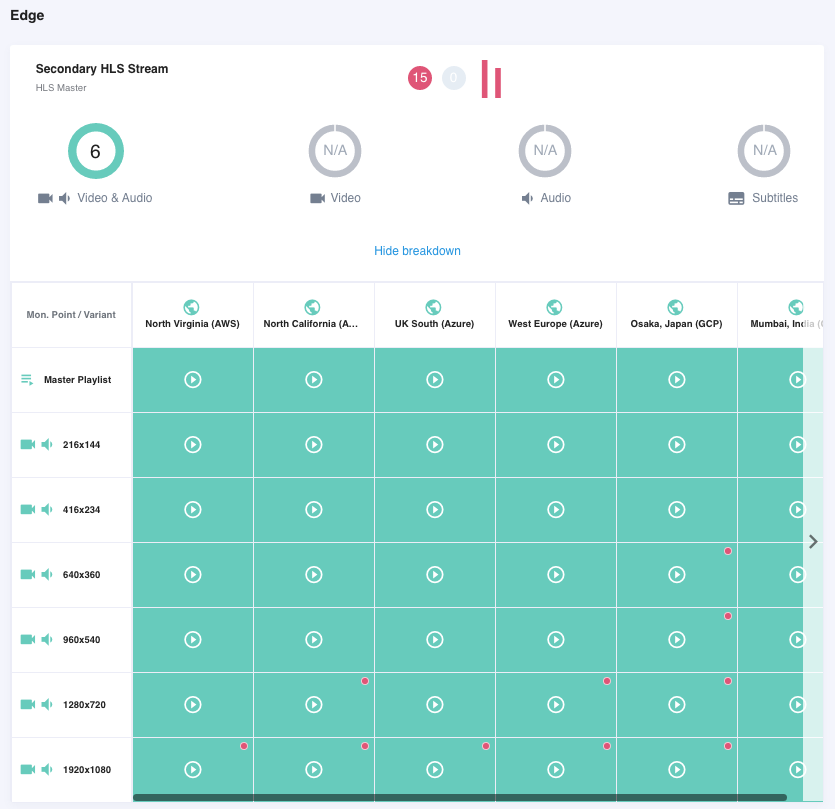
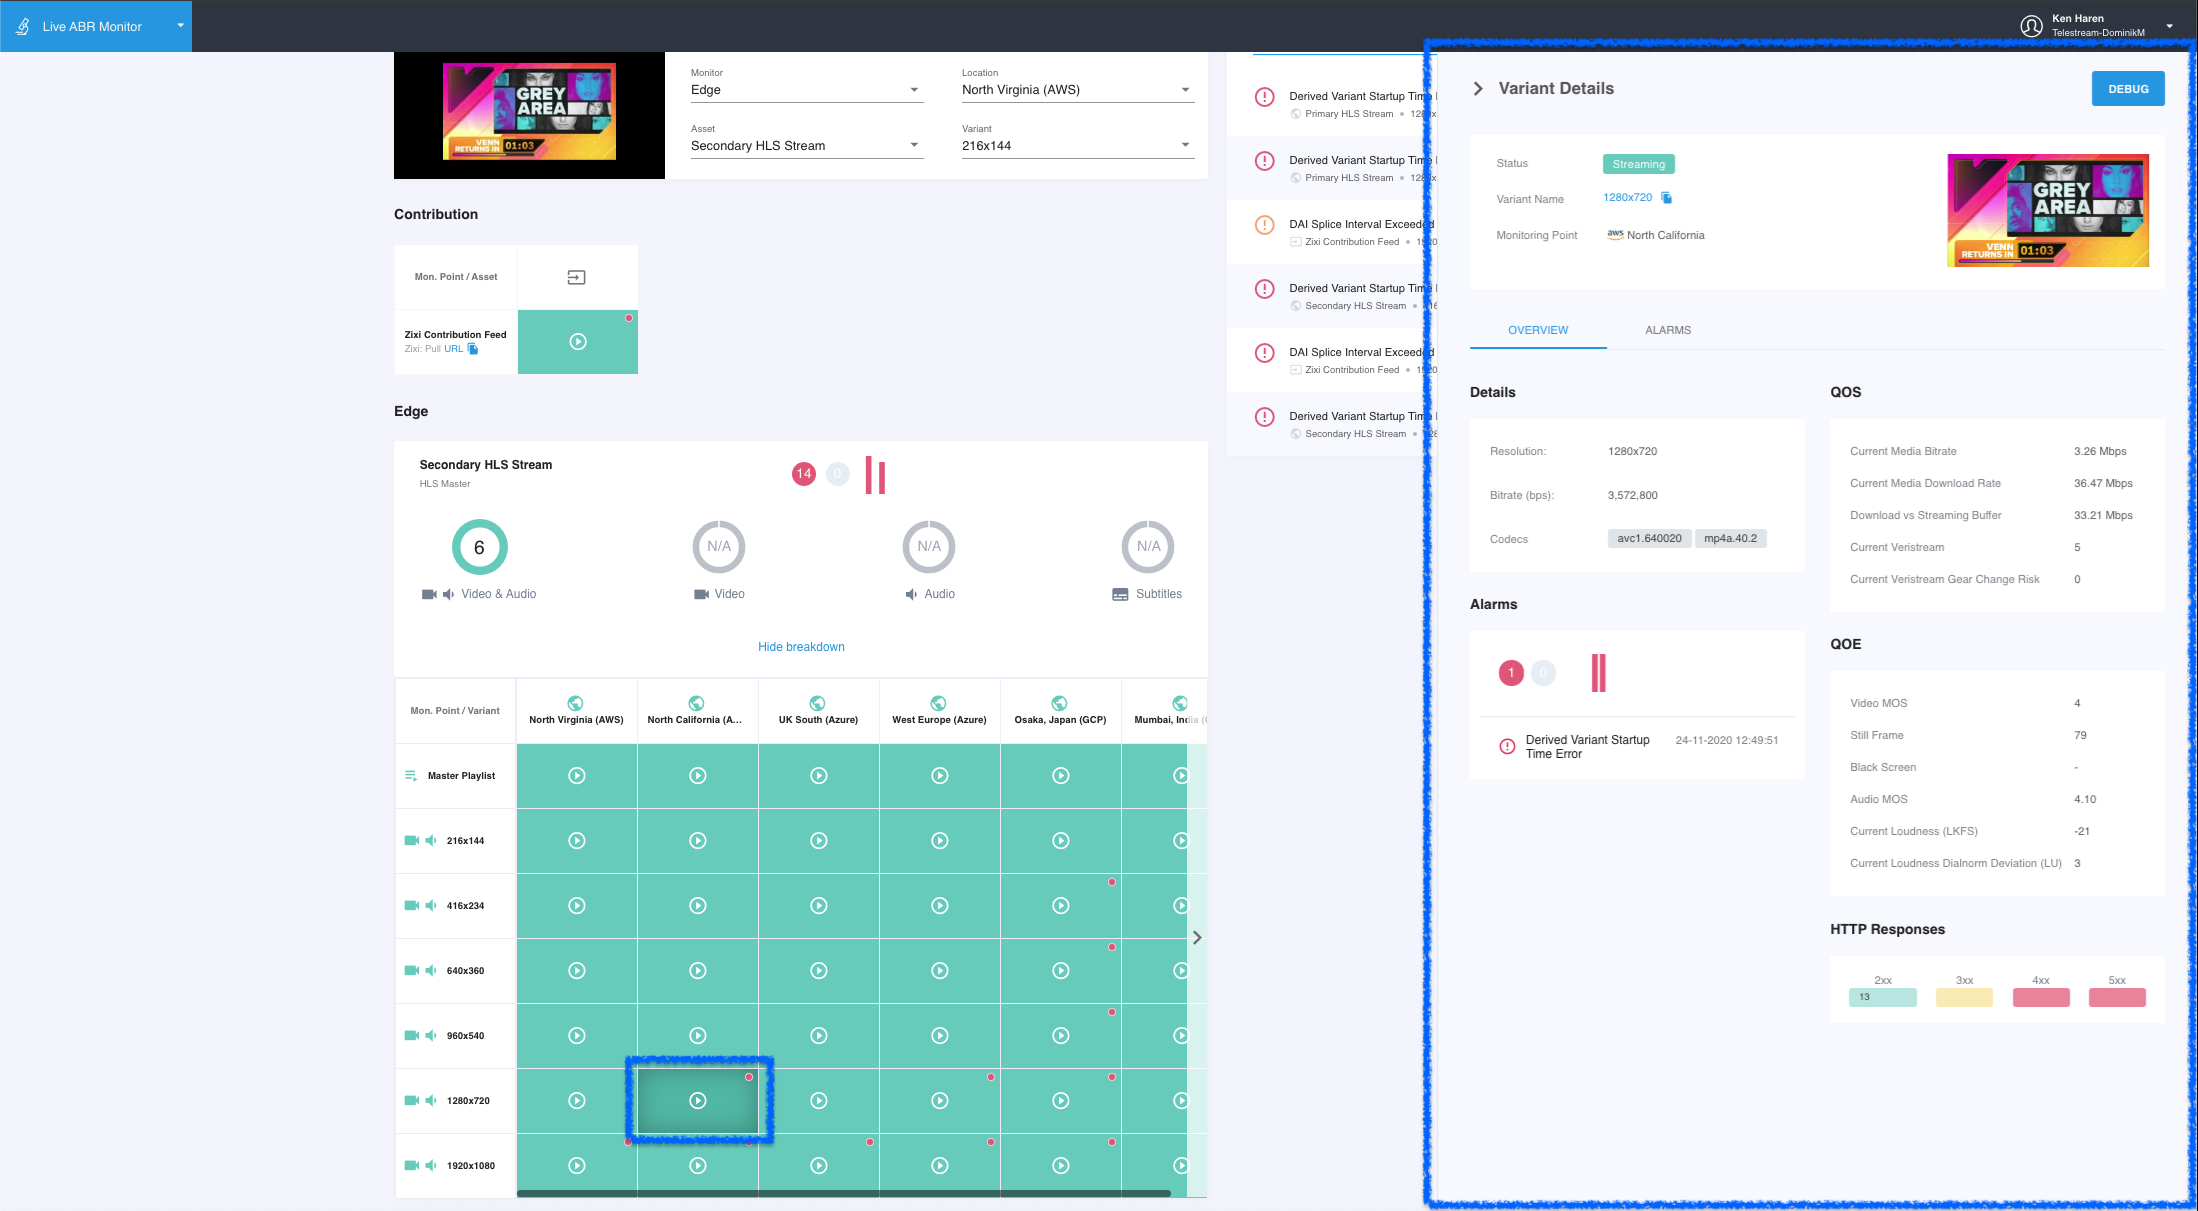
Edge assets tend to have a higher number of stream variants than contribution assets. Edge assets also tend to be monitored in multiple regions simultaneously. Because of this, the Edge asset has a summary and expanded detail view option. The edge feed status presents a realtime summary of the health of each edge asset within the channel. The expanded view for an edge asset shows the current status of every stream variant in every location. If an edge asset is being monitored in more locations than can fit in the display, a slider is added to enable sliding across regions to view health in each region.
In the detail view, if the stream is completely healthy with no active warning or alarms, a green box will display. A red or yellow dot inside the green box indicates that the edge stream is active and the monitoring point is seeing a valid ABR stream, but that something is either in an alarm (red) or warning (yellow) state. You can see an example of the alarm indicator in several of the stream variants in the image below. If the entire box is red, this is usually indicative of an outage, where the monitoring point cannot establish a connection to the stream. The summary and detail views are shown below.
Contribution & Edge Details Drawer
Selecting any contribution feed or edge ABR stream variant will result in the details drawer for that stream to slide out from the right side of the UI. The details drawer contains more details for the selected stream. The details included depends on whether a contribution or edge stream is selected.
Contribution Stream
- Status Summary / Thumbnail (if available)
- Full Metrics Suite
- Alarms Details (Current / Solved)
- Media Info
Edge Stream
- Status Summary / Thumbnail (if available)
- Media Info
- QOS Metrics
- QOE Metrics
- Alarm Summary
- Alarm Details (Current / Solved)
The data in these drawers is a realtime representation on the current status of the stream. The data will automatically update as new data becomes available, usually every 5 to 10 seconds.
Updated about 4 years ago
